

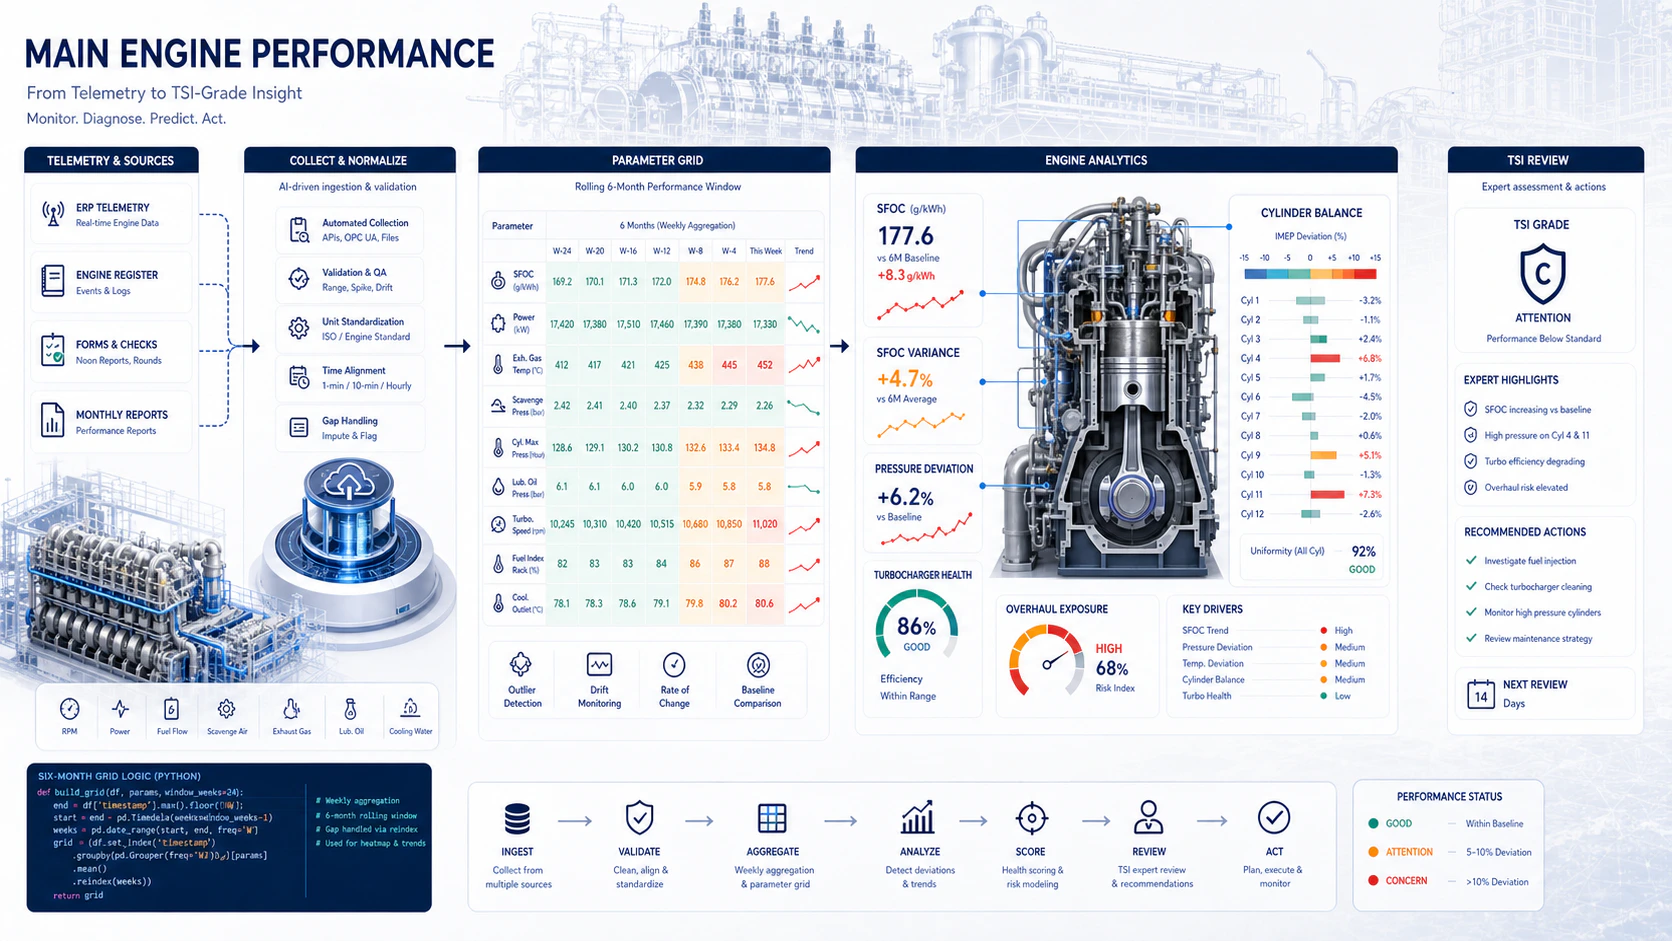
Main Engine Performance — six-month parameter rollups, cylinder uniformity, SFOC variance, turbocharger health, and overhaul timing in one TSI-grade review.
Executive summary
The main engine is the single most expensive equipment item on a vessel and the single largest fuel consumer. A 5% SFOC drift means several hundred dollars per day at sea — at scale, hundreds of thousands per year per vessel. A late cylinder overhaul means an engine failure at sea — usually the most expensive recovery a fleet ever sees. A misbalanced cylinder means an asymmetrically worn liner — eventually a major overhaul that should have been a top-end. The Main Engine Performance pipeline turns the existing data — ERP monthly performance reports, telemetry exports, the engine register — into something a Technical Superintendent can act on without reading every monthly file. It captures a six-month rolling window of every monitored parameter, computes deviations against the maker’s design and against the rest of the fleet, and routes anything that crosses an operating threshold to the right person.Architecture
Stage 1 — Data collection
Where the data comes from
ERP records the structured engine register and monthly reports; performance forms are vessel-side submissions; the microapp adds the visual evidence layer for owner / charterer correspondence. The pipeline supports two collectors with the same downstream contract:
- Standard collector
- Microapp collector (with visuals)
Pulls the latest performance entry from the ERP telemetry feed for one vessel at a time. Output is a single structured record covering the most recent reporting period.
What gets captured
Microapp collection adds:
- Polynomial baseline curves used by the microapp for deviation overlays
- Original shop-trial values for comparison
- Tab-by-tab screenshots: overview, deviation, trends, cylinder, turbocharger, alarms
Output
Both collectors append a timestamped record to the vessel’s main-engine case folder with the exact same fields, so the analyzer is collector-agnostic.Stage 2 — Analysis
2.1 Cylinder uniformity
Even cylinder loading is the single most important indicator of engine health. A cylinder running hotter than its neighbours points to a fuel-injector defect, a stuck exhaust valve, or piston-ring blow-by — usually weeks before the engine itself flags an alarm. The analyzer computes deviation per cylinder: Verdict:
The same deviation maths runs on Pmax and Pcomp. A cylinder that is hot and has low Pmax is the classic exhaust-valve signature; a cylinder that is hot and has high Pmax usually points to fuel-injector overdelivery.
2.2 SFOC variance
Specific Fuel Oil Consumption is load-dependent — comparing raw values across operating points produces nonsense. The analyzer always normalises to the maker’s design SFOC at the current load: A 3-point moving average smooths month-to-month noise; persistent variance above 5% is flagged, above 8% triggers escalation.2.3 Six-month parameter rollup
Trend matters more than spot values. The analyzer builds a rolling six-month grid of every monitored parameter — per cylinder per month — and surfaces parameters whose mean is drifting. Missing months are surfaced too: a vessel that hasn’t filed a performance report for three consecutive months is itself a red flag.Code snapshot
The dashboard logic that drives the rollup, condensed:2.4 Pressure deviation
Peak combustion pressure, mean indicated pressure, and scavenge pressure are checked against the maker’s spec for the operating point. The analyzer maps deviations to specific failure modes:2.5 Turbocharger health
Turbocharger boost low and exhaust back-pressure high is the textbook turbo-fouling signature. The analyzer computes: A falling across three reports is flagged for cleaning regardless of whether either pressure is individually outside spec.2.6 Overhaul timing
Hours-to-next overhaul are computed against the maker’s interval: Tier mapping:Worked example
Vessel:MV ONE ATLAS (IMO 9290127), MAN 8K90 MC-C.
After a refresh, the analyzer reports:
Composite verdict: HIGH — cylinder 5 has converging signals (hot, low Pmax, near overhaul). The pipeline:
- Sets escalation flag, priority CRITICAL
- Updates the case to
awaiting-tsi-review - Sends an A2A message to the TSI inbox with the per-cylinder evidence and the recommended actions
- Schedule cylinder 5 fuel-injector replacement at next port — coordinate spares.
- Schedule turbocharger water wash within 7 days; wet-cleaning at next port.
- Plan cylinder 5 top-end overhaul at the next docking window — book superintendent attendance.
Output deliverables
- Executive summary — overall ME status, headline findings
- Cylinder uniformity table — per-cylinder deviation, severity, likely cause
- SFOC analysis — variance trend, cost impact, root-cause candidates
- Six-month parameter rollup — every parameter per cylinder per month, gaps surfaced
- Pressure analysis — deviation per cylinder, mapped to failure mode
- Turbocharger assessment — trend
- Overhaul plan — urgent / upcoming, port-call coordination
- Recommendations — prioritised actions with timeline and cost
- Escalation decision — auto-routed to TSI when triggered
Escalation triggers
Why script-driven
Cylinder-deviation maths, SFOC-curve normalisation, and pressure-spec lookups all live in deterministic Python templates. The model interprets results into narrative; it doesn’t recompute. That means a review of POSUN this month and the same review next month produce identical numbers given identical inputs — which is the only way an audit trail holds up.The microapp collector and the standard collector produce the same downstream record. The choice is operational: when a review will be referenced by a charterer or in a Class dispute, use the microapp collector so the screenshots travel with the numbers.
References
Source templates
Performance analysis suite — ME monthly parameter rollup and engine specifications & running hours.
Related: Auxiliary engines
Same analysis pattern, applied to AE generators.
Related: Lube oil
Wear-metal trends often confirm or rule out a cylinder finding.
Related: Fuel oil
Fuel quality is the most common root cause for sustained SFOC variance.