

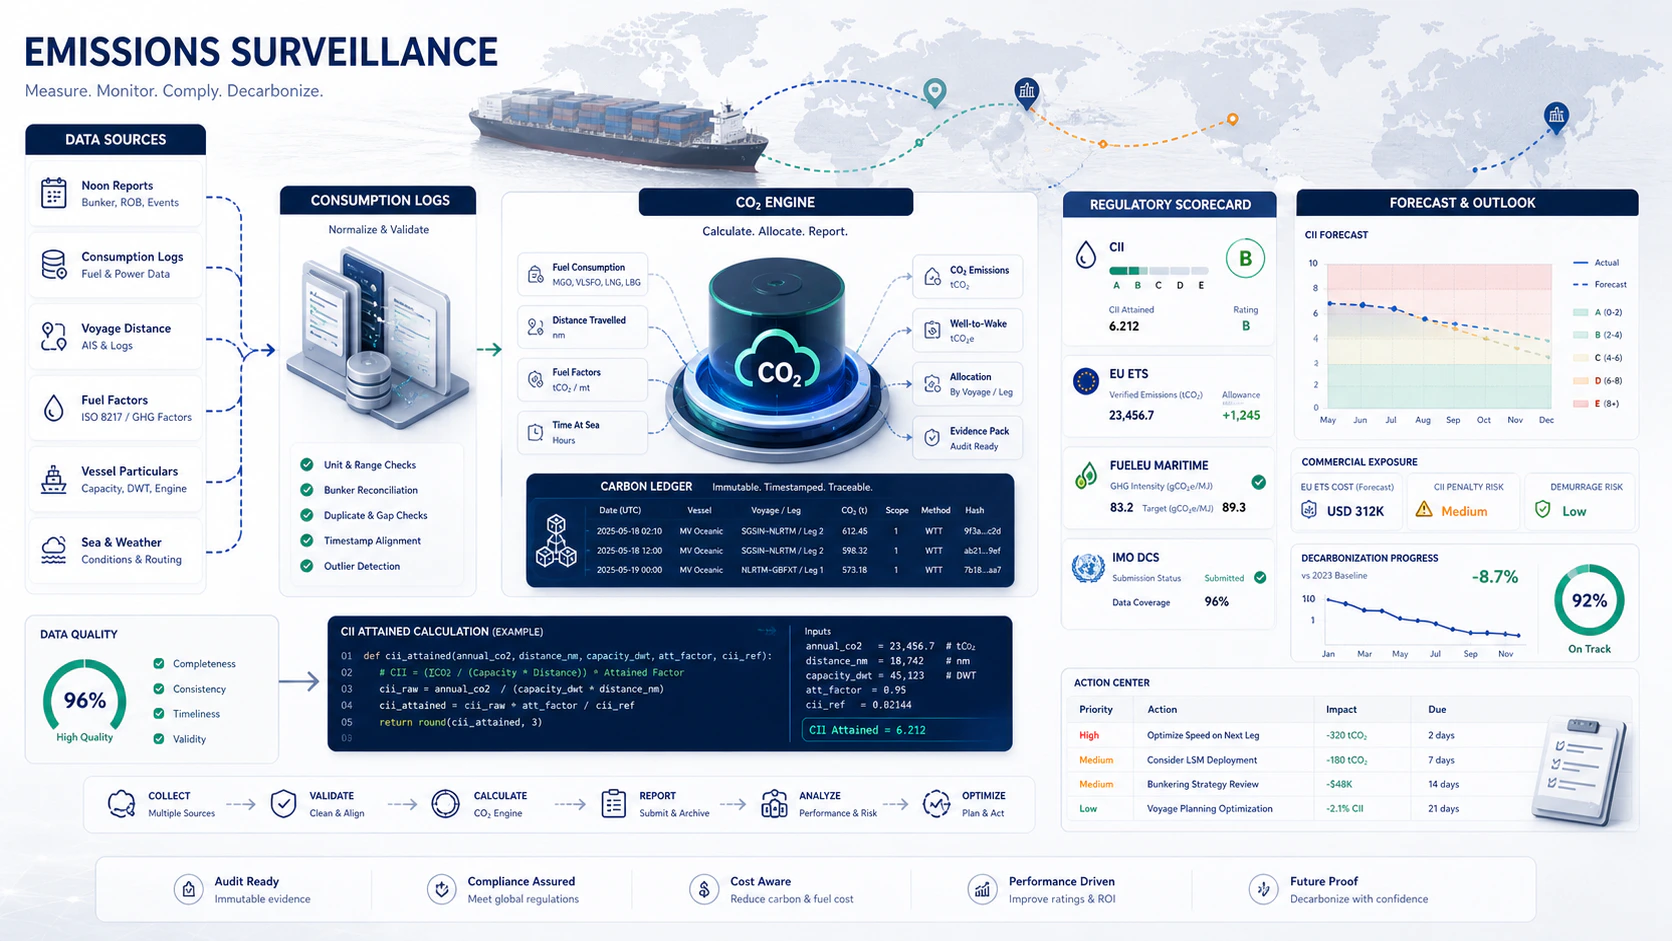
Emissions Surveillance — CII, EEOI, EU ETS, FuelEU and IMO DCS computed in parallel from noon reports and bunker records, projected to year-end.
Where the data comes from
The numbers come from a single internal source — noon reports plus bunkering records. Everything else (CII bands, EU allowance prices, FuelEU compliance line) is reference data the pipeline applies on top.
The five regimes
Each regime uses the same source data but slices it differently — what counts as “emissions in scope” varies, and the metric definition varies. The pipeline computes each regime independently because they don’t reduce to a single number.
CII — the centerpiece
The IMO Carbon Intensity Indicator is the most operationally consequential of the five. The attained CII for a vessel: \text{CII}_\text{attained} = \frac{\sum_{i} \text{CO}_2_i \text{ (g)}}{\text{Capacity} \cdot \sum_{i} \text{Distance}_i \text{ (nm)}} where capacity is DWT (or GT for passenger vessels) and the sum is over all voyages in the operating year. CO₂ per fuel: \text{CO}_2_i = m_\text{fuel}_i \cdot \text{CF}_\text{fuel} with CF (carbon factor) values:
The required CII for the year, , is set by IMO per vessel type and DWT. The rating bands:
A vessel rated D for three consecutive years must update its SEEMP III with corrective measures. A vessel rated E for one year must do the same.
CII trajectory and forecast
The pipeline doesn’t just report the latest CII — it forecasts year-end. Two methods compose:Method 1 — Linear projection
where is the trend over the last 3 months and is year-end.Method 2 — Operational profile
If the vessel’s voyage plan for the rest of the year is known, the analyzer projects emissions using planned distance and projected fuel consumption per leg. More accurate when the operational pattern is stable. The forecast is reported as a confidence range — a vessel currently at C-band attaining 1.05 with a forecast of 1.09 is heading into D territory, but the band depends on the residual operational pattern. Surfacing the range early (mid-year) gives time to act.EEOI
The voyage-level energy-efficiency indicator: \text{EEOI} = \frac{\sum_i \text{CO}_2_i}{\sum_i (m_\text{cargo}_i \cdot D_i)} EEOI uses cargo-tonne-miles rather than capacity-miles, so it captures actual cargo carried rather than theoretical capacity. A vessel running below capacity (typical on backhauls) shows high EEOI relative to CII — useful signal that the operational pattern is the issue rather than the engineering. EEOI is computed per voyage and aggregated per quarter and per year for trending.EU ETS
EU Emissions Trading System obligations cover:- 100% of CO₂ on intra-EU voyages
- 50% of CO₂ on EU-extra-EU voyages (one end EU)
- 0% on extra-EU voyages
FuelEU Maritime
FuelEU is intensity-based and well-to-wake, so it captures the upstream emissions of the fuel as well as the combustion emissions. The regime uses GHG intensity (gCO₂eq/MJ) rather than CO₂ mass: where is energy content of fuel consumed in scope. Compared against a reducing target intensity (the “compliance line”) that drops year-on-year. Non-compliance is penalised per gram of GHG above the target, multiplied by total energy consumed. Renewable fuels (biofuels with ISCC certification) get a multiplier — they reduce GHG intensity proportionally to their share of energy mix, which can move a non-compliant vessel into compliance without operational changes.IMO DCS
The annual fuel consumption reporting regime. Produces a single annual report per vessel with per-fuel-type consumption, distance, and hours under way. Less commercially consequential than the other regimes but a hard regulatory deadline. The pipeline tracks the data integrity for the DCS report — same data quality requirements that the consumption log validator checks before submission.Fleet rating dashboard
The fleet view assembles every vessel’s CII rating in one table:Implementation reference
CII attained calculation, condensed:Worked example
MV OCEAN, 82,000 DWT container, end-of-April review (4 months into operating year):
EU ETS YTD obligation: 4,180 EUAs (~~€352k at €84/EUA).
EU ETS year-end forecast: 12,500 EUAs (~~€1.05M).
FuelEU GHG intensity YTD: 86.8 gCO₂eq/MJ vs target 89.3 → currently compliant by margin.
Verdict: HIGH-CRITICAL on CII trajectory. The operational forecast crosses the E threshold. Three actions become candidates:
- Slow-steaming: reducing average speed by 1 knot reduces CO₂ per nm meaningfully. Cross-references the voyage pipeline for CP impact (some CPs allow it).
- Bunker mix shift: switching VLSFO portion to MGO improves combustion efficiency but increases mass slightly — net carbon impact is marginal. Better to look at LNG dual-fuel if available.
- Operational efficiency: hull cleaning, propeller polishing — engineering changes that reduce required power for the same speed.
- Routes to the Operations / Commercial team — operational change candidates.
- Routes to the ME performance pipeline for the engineering side (hull fouling? Engine SFOC?).
- Generates the EU ETS purchase plan at the projected year-end demand.
What the senior review contains
- Headline ratings — current and projected CII, EU ETS YTD and forecast, FuelEU compliance margin.
- CII trajectory — chart with attained-through-time, projected year-end, rating bands shaded.
- Per-voyage EEOI — operational efficiency metric for trending.
- EU ETS obligation — running EUA demand, projected year-end, financial impact at current market.
- FuelEU intensity — GHG intensity vs target, biofuel share if any.
- IMO DCS data quality — completeness check before annual submission.
- Operational change candidates — modelled impact of slow-steaming, bunker shift, hull-cleaning.
- Recommendations — prioritised by impact and feasibility.
- Escalation decision — to whom, and why.
Escalation triggers
Why all five together
A vessel can have A-rated CII and still fail FuelEU if its fuel mix is heavy. A vessel passing FuelEU can be commercially exposed on EU ETS price spikes. A clean IMO DCS report doesn’t help if the underlying CII rating is dropping. The five regimes operate independently and have to be tracked together — the pipeline runs all five computations on every refresh.The single most consequential improvement most fleets can make on CII is hull cleaning frequency. A fouled hull adds 5–10% to the power required for the same speed; that translates directly to attained CII. The pipeline cross-references hull condition and propeller polishing dates so the operational levers are visible.
References
Source templates
Emission-monitoring suite — per-voyage EEOI, CII data with historical and forecast trajectory, and the fleet-wide CII rating view.
Microapp: Emissions
Live dashboard with all five regimes — the user-facing surface for the same data.
Related: Voyage
Voyage performance and slow-steaming decisions are CII-relevant.
Related: Fuel oil
Fuel mix decisions are emissions decisions — bunker grade affects CII, EU ETS, and FuelEU.