

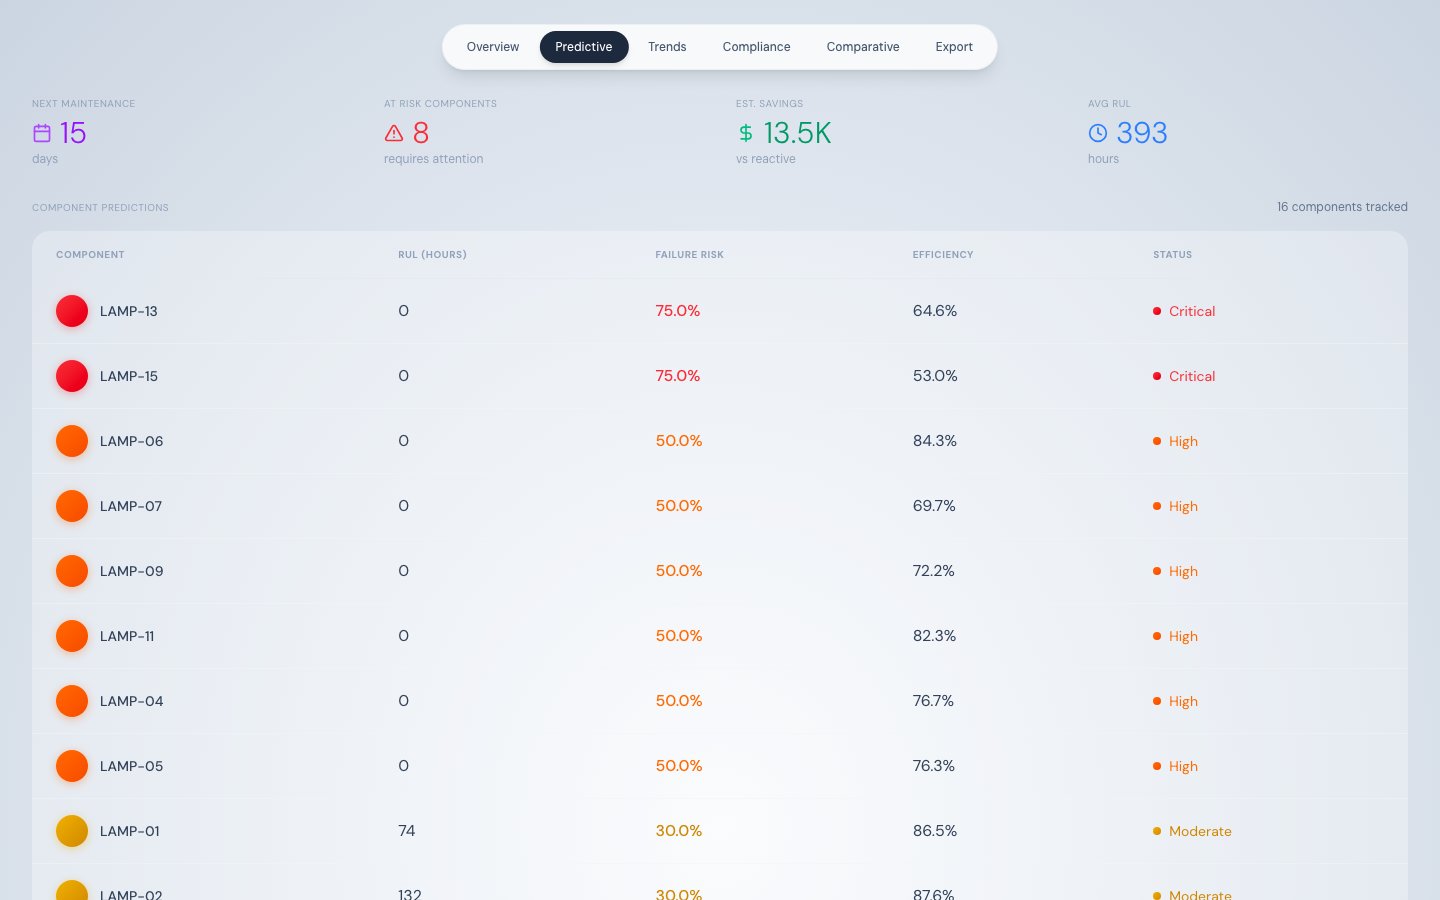
Predictive Maintenance Tab — component predictions sorted by failure risk
What this tab shows
The Predictive Maintenance tab surfaces pre-computed ML predictions for every UV lamp. It helps engineers prioritise which lamps to replace at the next port call and quantifies the cost benefit of acting on predictions rather than waiting for failures. Data is fetched from/api/predictions?limit=100. The tab filters to component_type === 'UV_LAMP', deduplicates to the latest prediction per lamp by comparing timestamps, then sorts by failure_probability descending so the most at-risk lamps appear first.
Summary stat row
Component predictions table
Each row represents one UV lamp with four columns:Risk thresholds
Upcoming Maintenance section
Three upcoming maintenance tasks are shown with urgency indicators:Cost Comparison panel
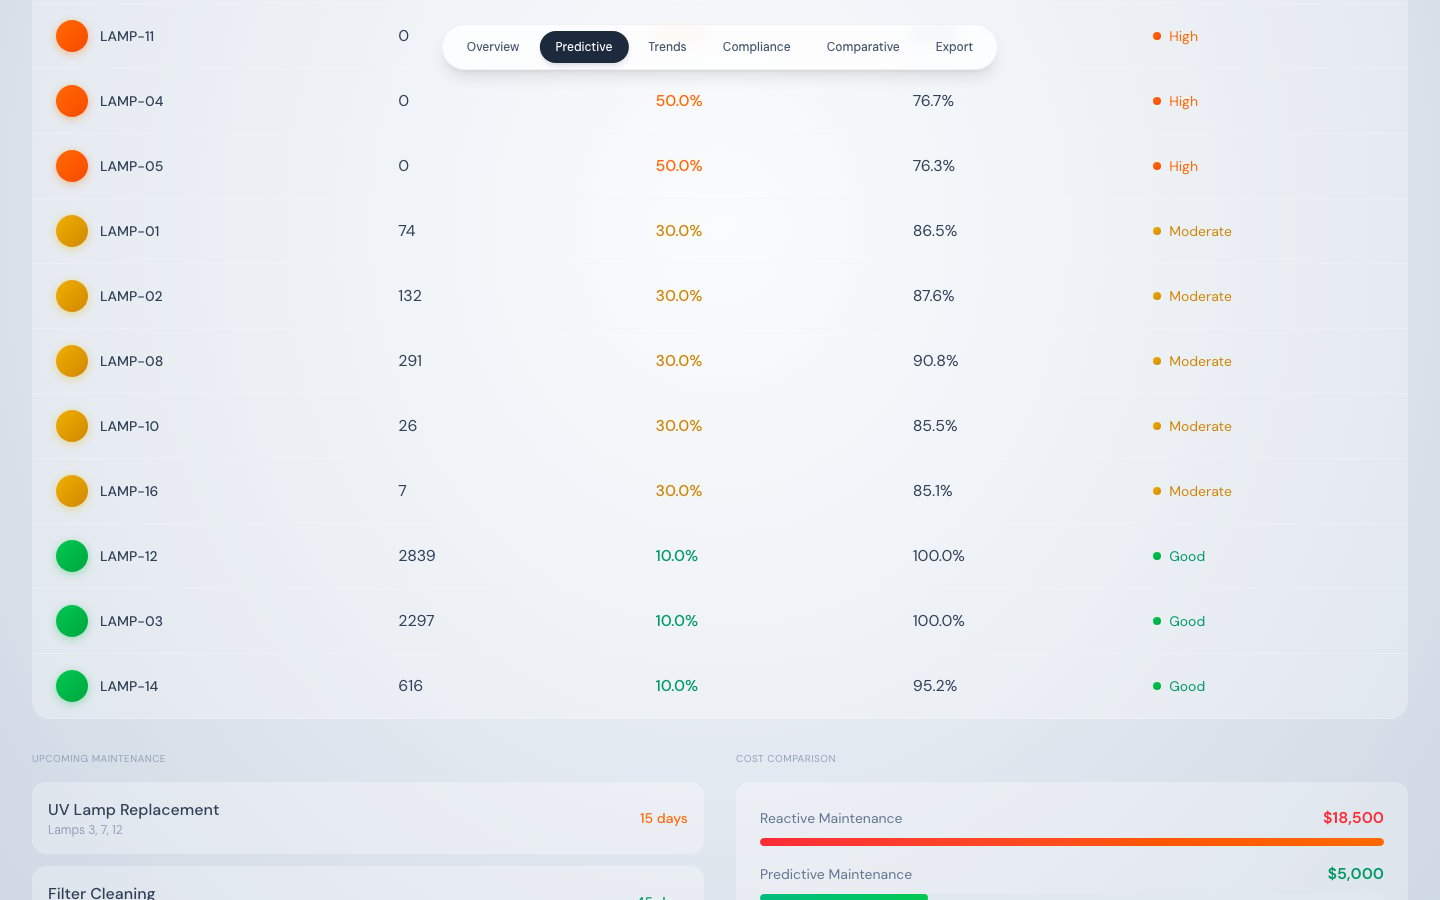
Cost comparison — reactive vs predictive maintenance
The cost model illustrates the financial case for acting on RUL predictions. Actual savings depend on vessel schedule and parts procurement.
How to interpret RUL
- RUL = 0: Failure is predicted to be imminent. Replace at the earliest opportunity.
- RUL = 500h: At a 3-minute telemetry interval (20 readings/hour), approximately 10,000 more readings before predicted failure — roughly 25 days of continuous operation.
- RUL = 2,500h on a new lamp: Lamp is at approximately 17% of rated life consumed. No action needed.
Source
/api/predictions?limit=100— all ML predictions- Client-side deduplication and sorting (no secondary API call for sorting)