

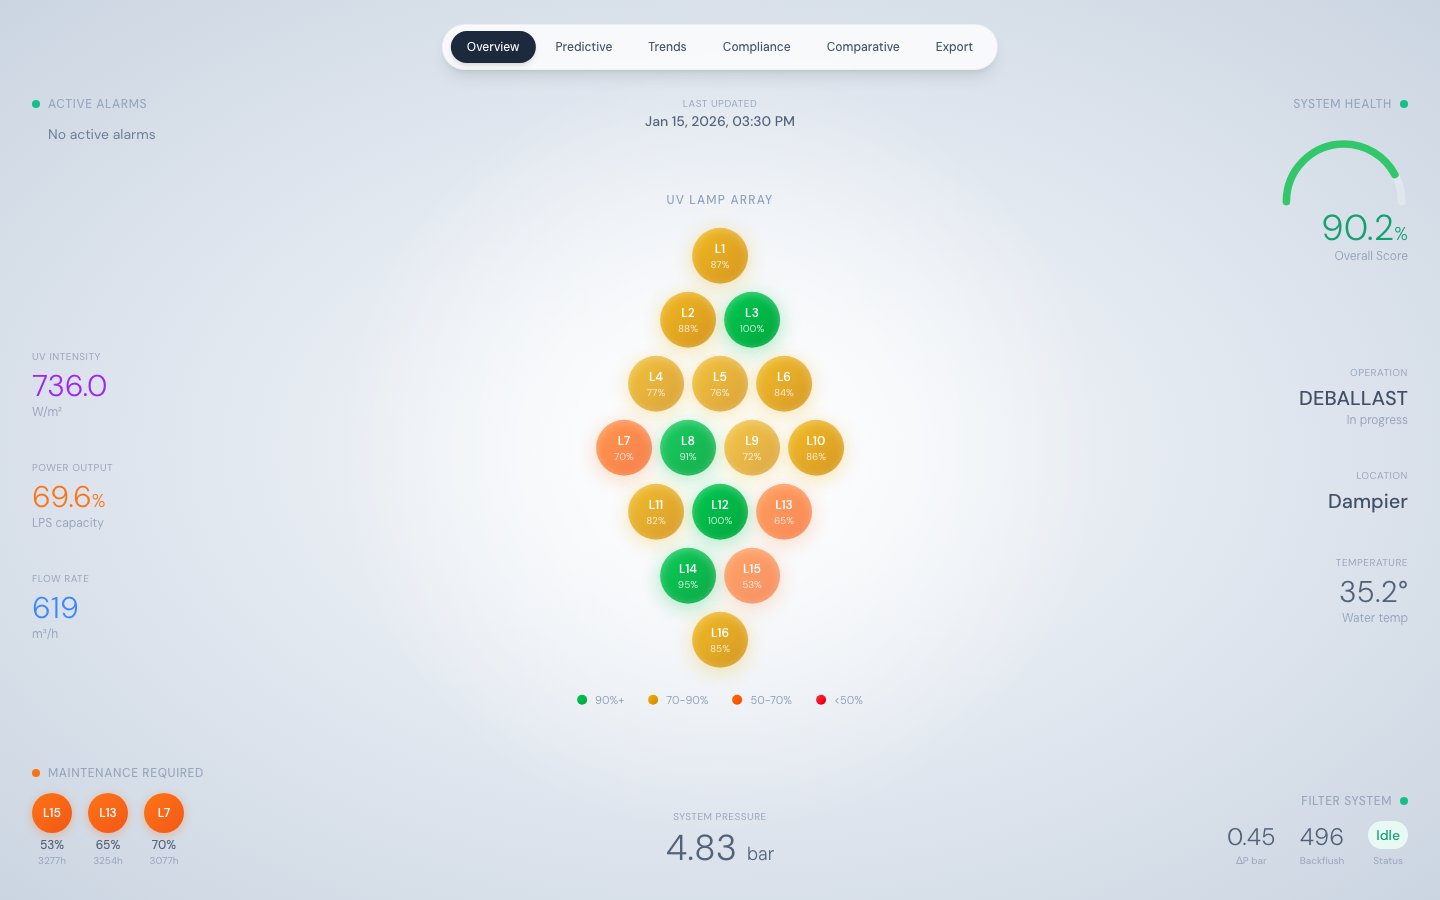
BWTS Overview — real-time lamp array, health gauge, and operational metrics
Layout philosophy
The Overview tab uses a radial “gravitational” design — the 16-lamp diamond array occupies the centre of the screen as the primary focal point, and all supporting metrics float at the edges. There are no card borders or containers; typography hierarchy and spacing replace visual dividers. The background is a radial gradient from light slate to medium slate. Data is fetched from/api/stats and auto-refreshes every 30 seconds.
The diamond lamp array
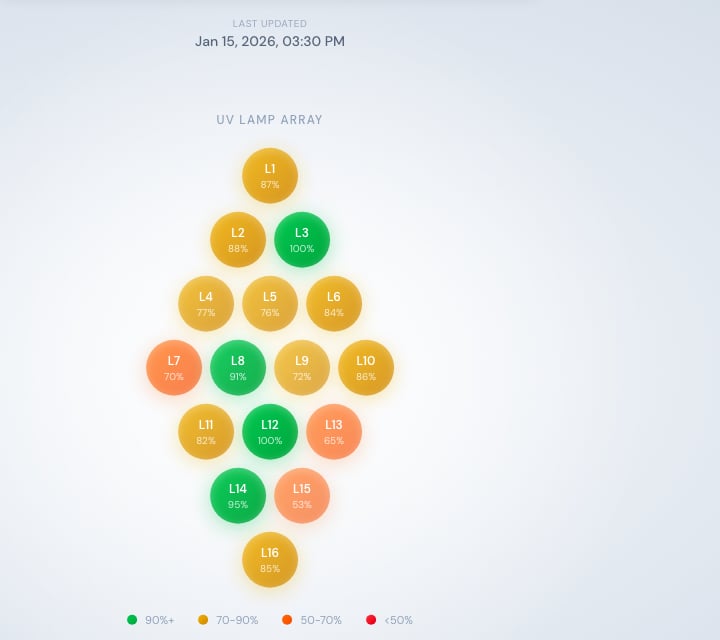
The 16-lamp diamond array, colour-coded by efficiency
- Lamp number — L01 through L16
- Efficiency percentage — the current
LAMP_XX_EFFICIENCYvalue - Colour — coded by efficiency tier (see table below)
- Opacity — scales with efficiency, providing an immediate at-a-glance scan
Lamp colour coding
Metric panels
Top-left: Active Alarms
Displays the last 3ALARM_TRIGGERED events from the event feed. An animated amber dot appears when any alarm is present. Each entry shows the event description and timestamp. Source: /api/stats → recentEvents.
Top-right: System Health Gauge
An SVG arc gauge showing theoverall_score (0–100) from the latest health record. The colour of the gauge arc changes with the score:
Left side: UV and power metrics
Right side: Operational context
Bottom-left: Maintenance Required
Lists up to three lamps with efficiency below 75% or runtime above 2,500 hours, sorted by lowest efficiency first. This provides an at-a-glance maintenance priority list without navigating to the Predictive Maintenance tab.Bottom-center: System Pressure
DisplaysSYS_PRESSURE in bar.
Bottom-right: Filter System
What you can do here
- Get an immediate read on system health without navigating any menus
- Spot failing or degraded lamps instantly by scanning the diamond for red or orange circles
- Check whether UV intensity is above the IMO (252 W/m²) or USCG (530 W/m²) compliance threshold
- See recent alarms and their timestamps
- Monitor filter backflush activity which can indicate water quality issues
Source
Data is served by/api/stats, which runs four parallel database queries and returns latestTelemetry, latestHealth, recentEvents, and monthlyAvg in a single response. This keeps the Overview tab to a single HTTP round-trip.