

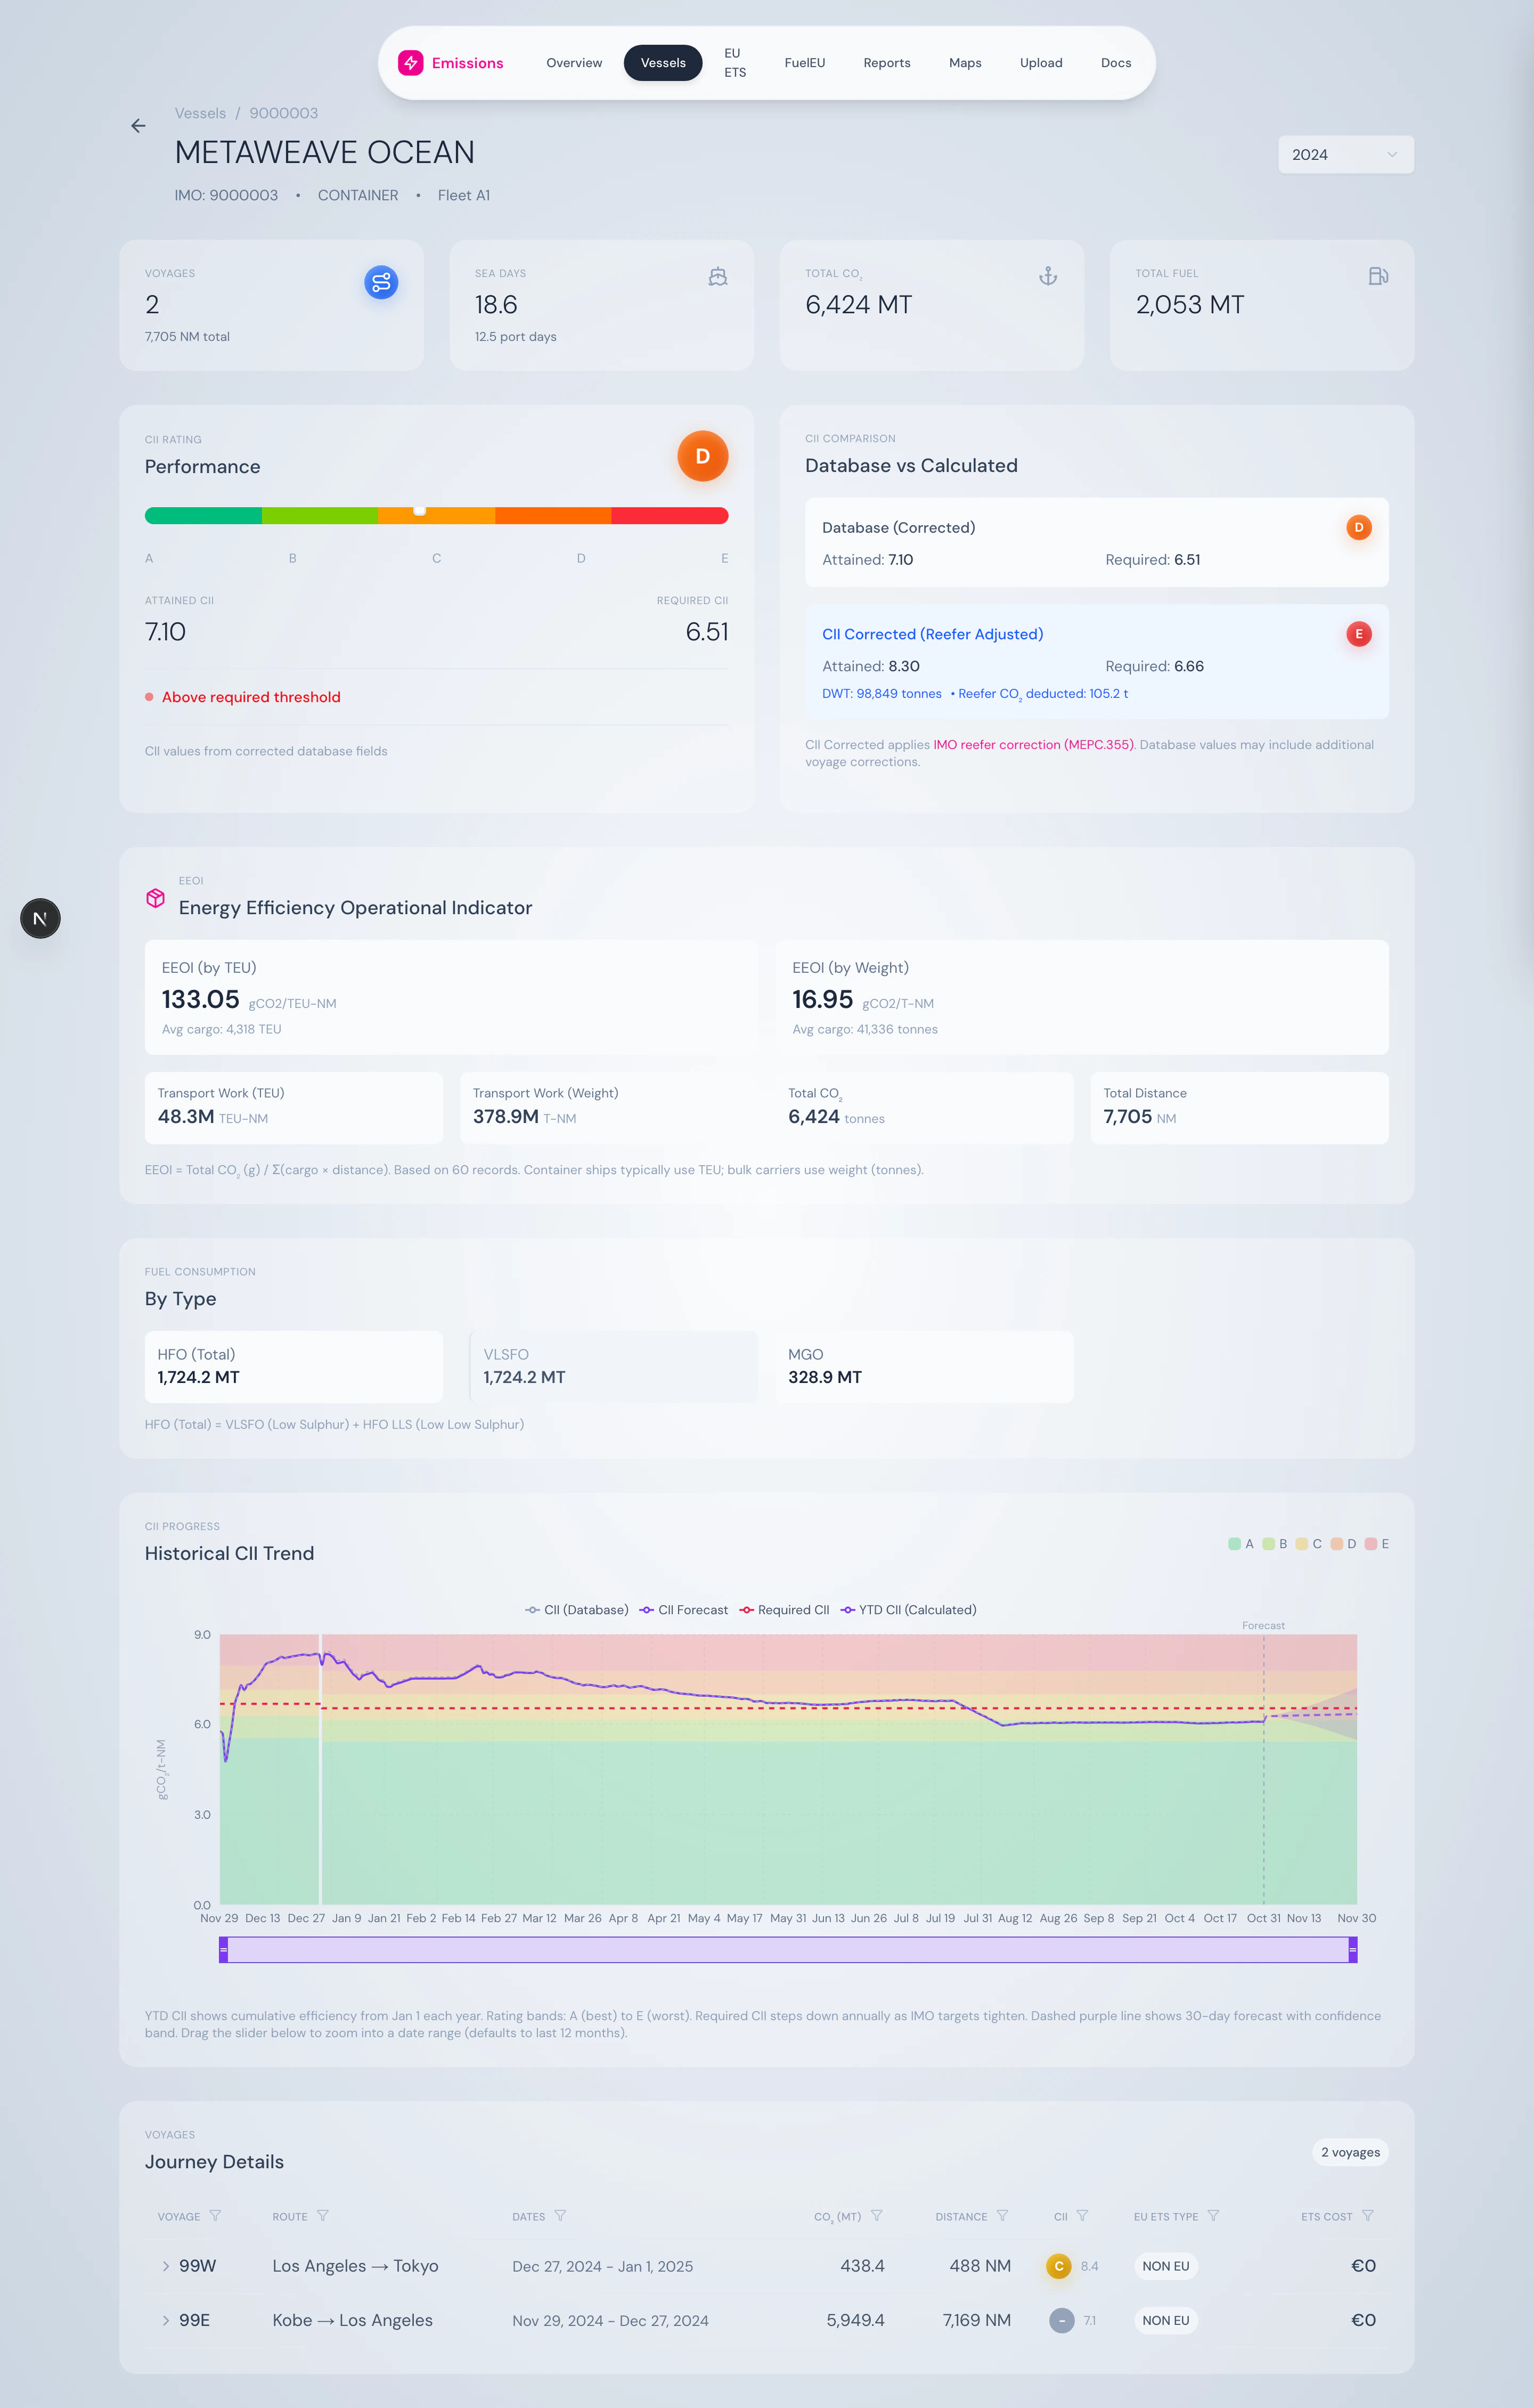
Vessel detail header — name, IMO, type, fleet, year selector.
What’s on the page
Summary cards
Four cards across the top: Voyages (count + total distance), Sea Days (+ port days), Total CO₂, Total Fuel. Each card is one number plus a sub-figure for context.CII performance
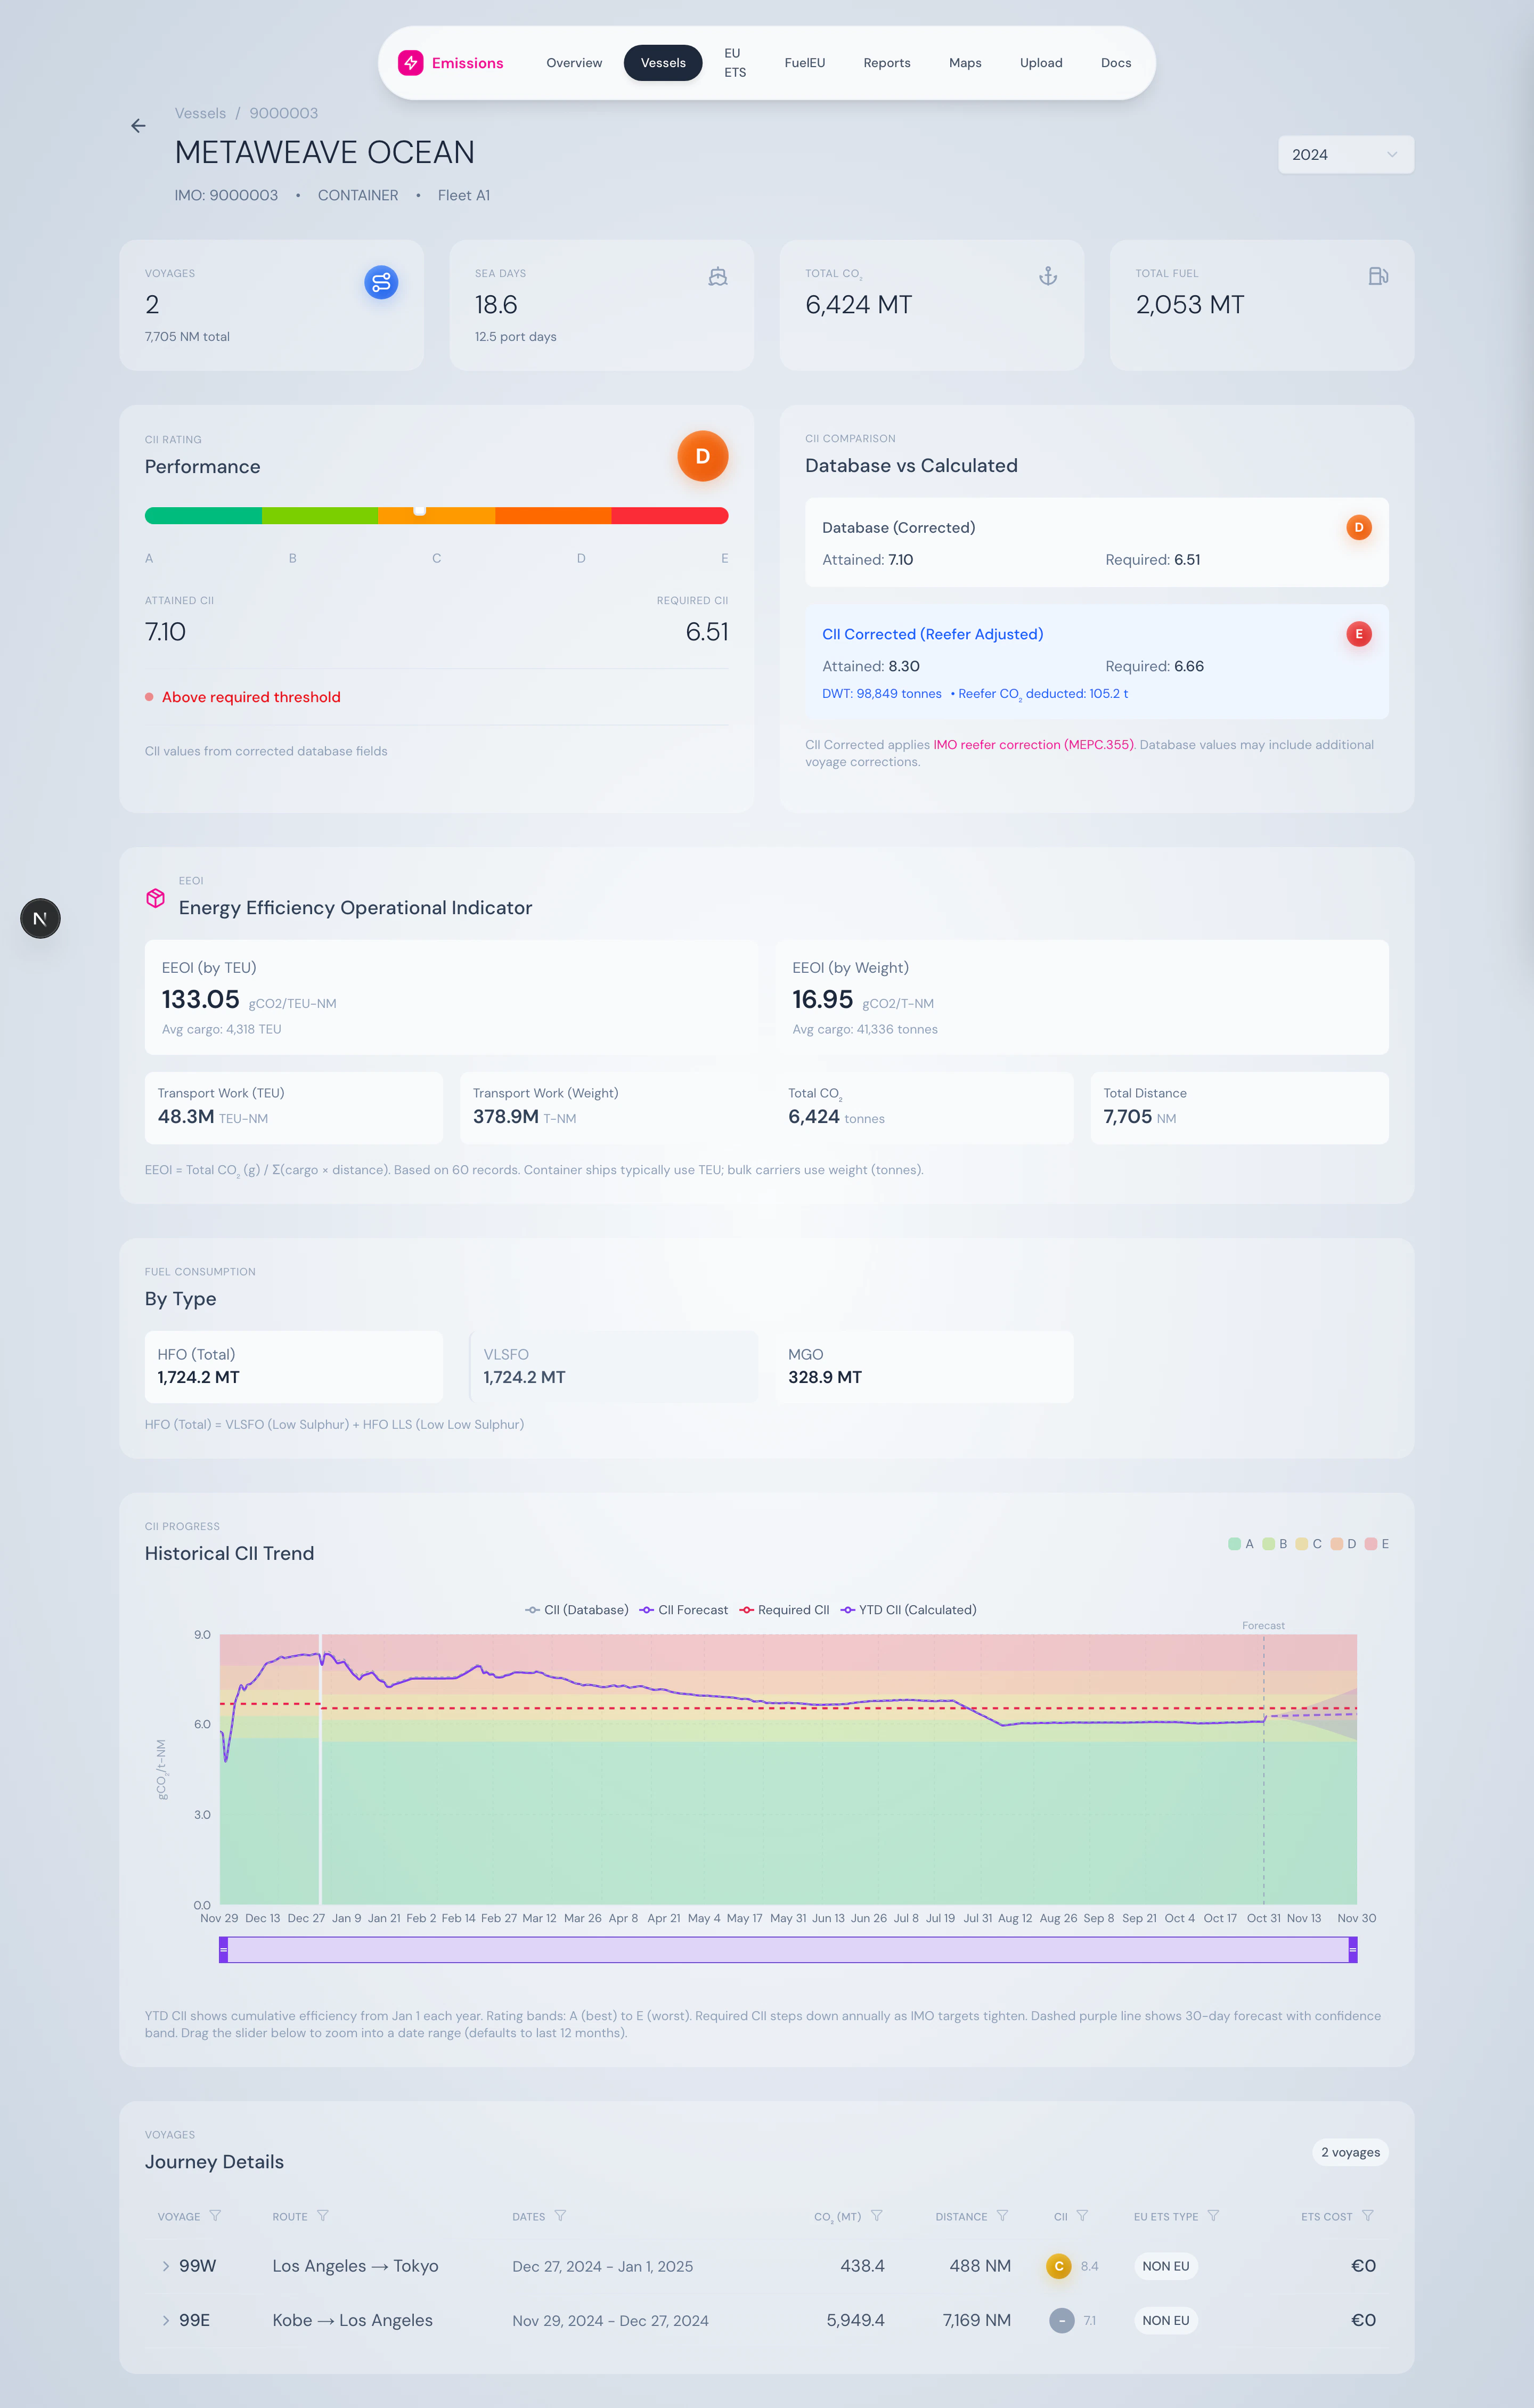
CII gauge with rating bands and a side-by-side comparison of database vs. reefer-corrected CII.
- Database CII — what’s reported in the consumption logs
- Corrected CII — with reefer container CO₂ stripped out per MEPC.355(78)
EEOI
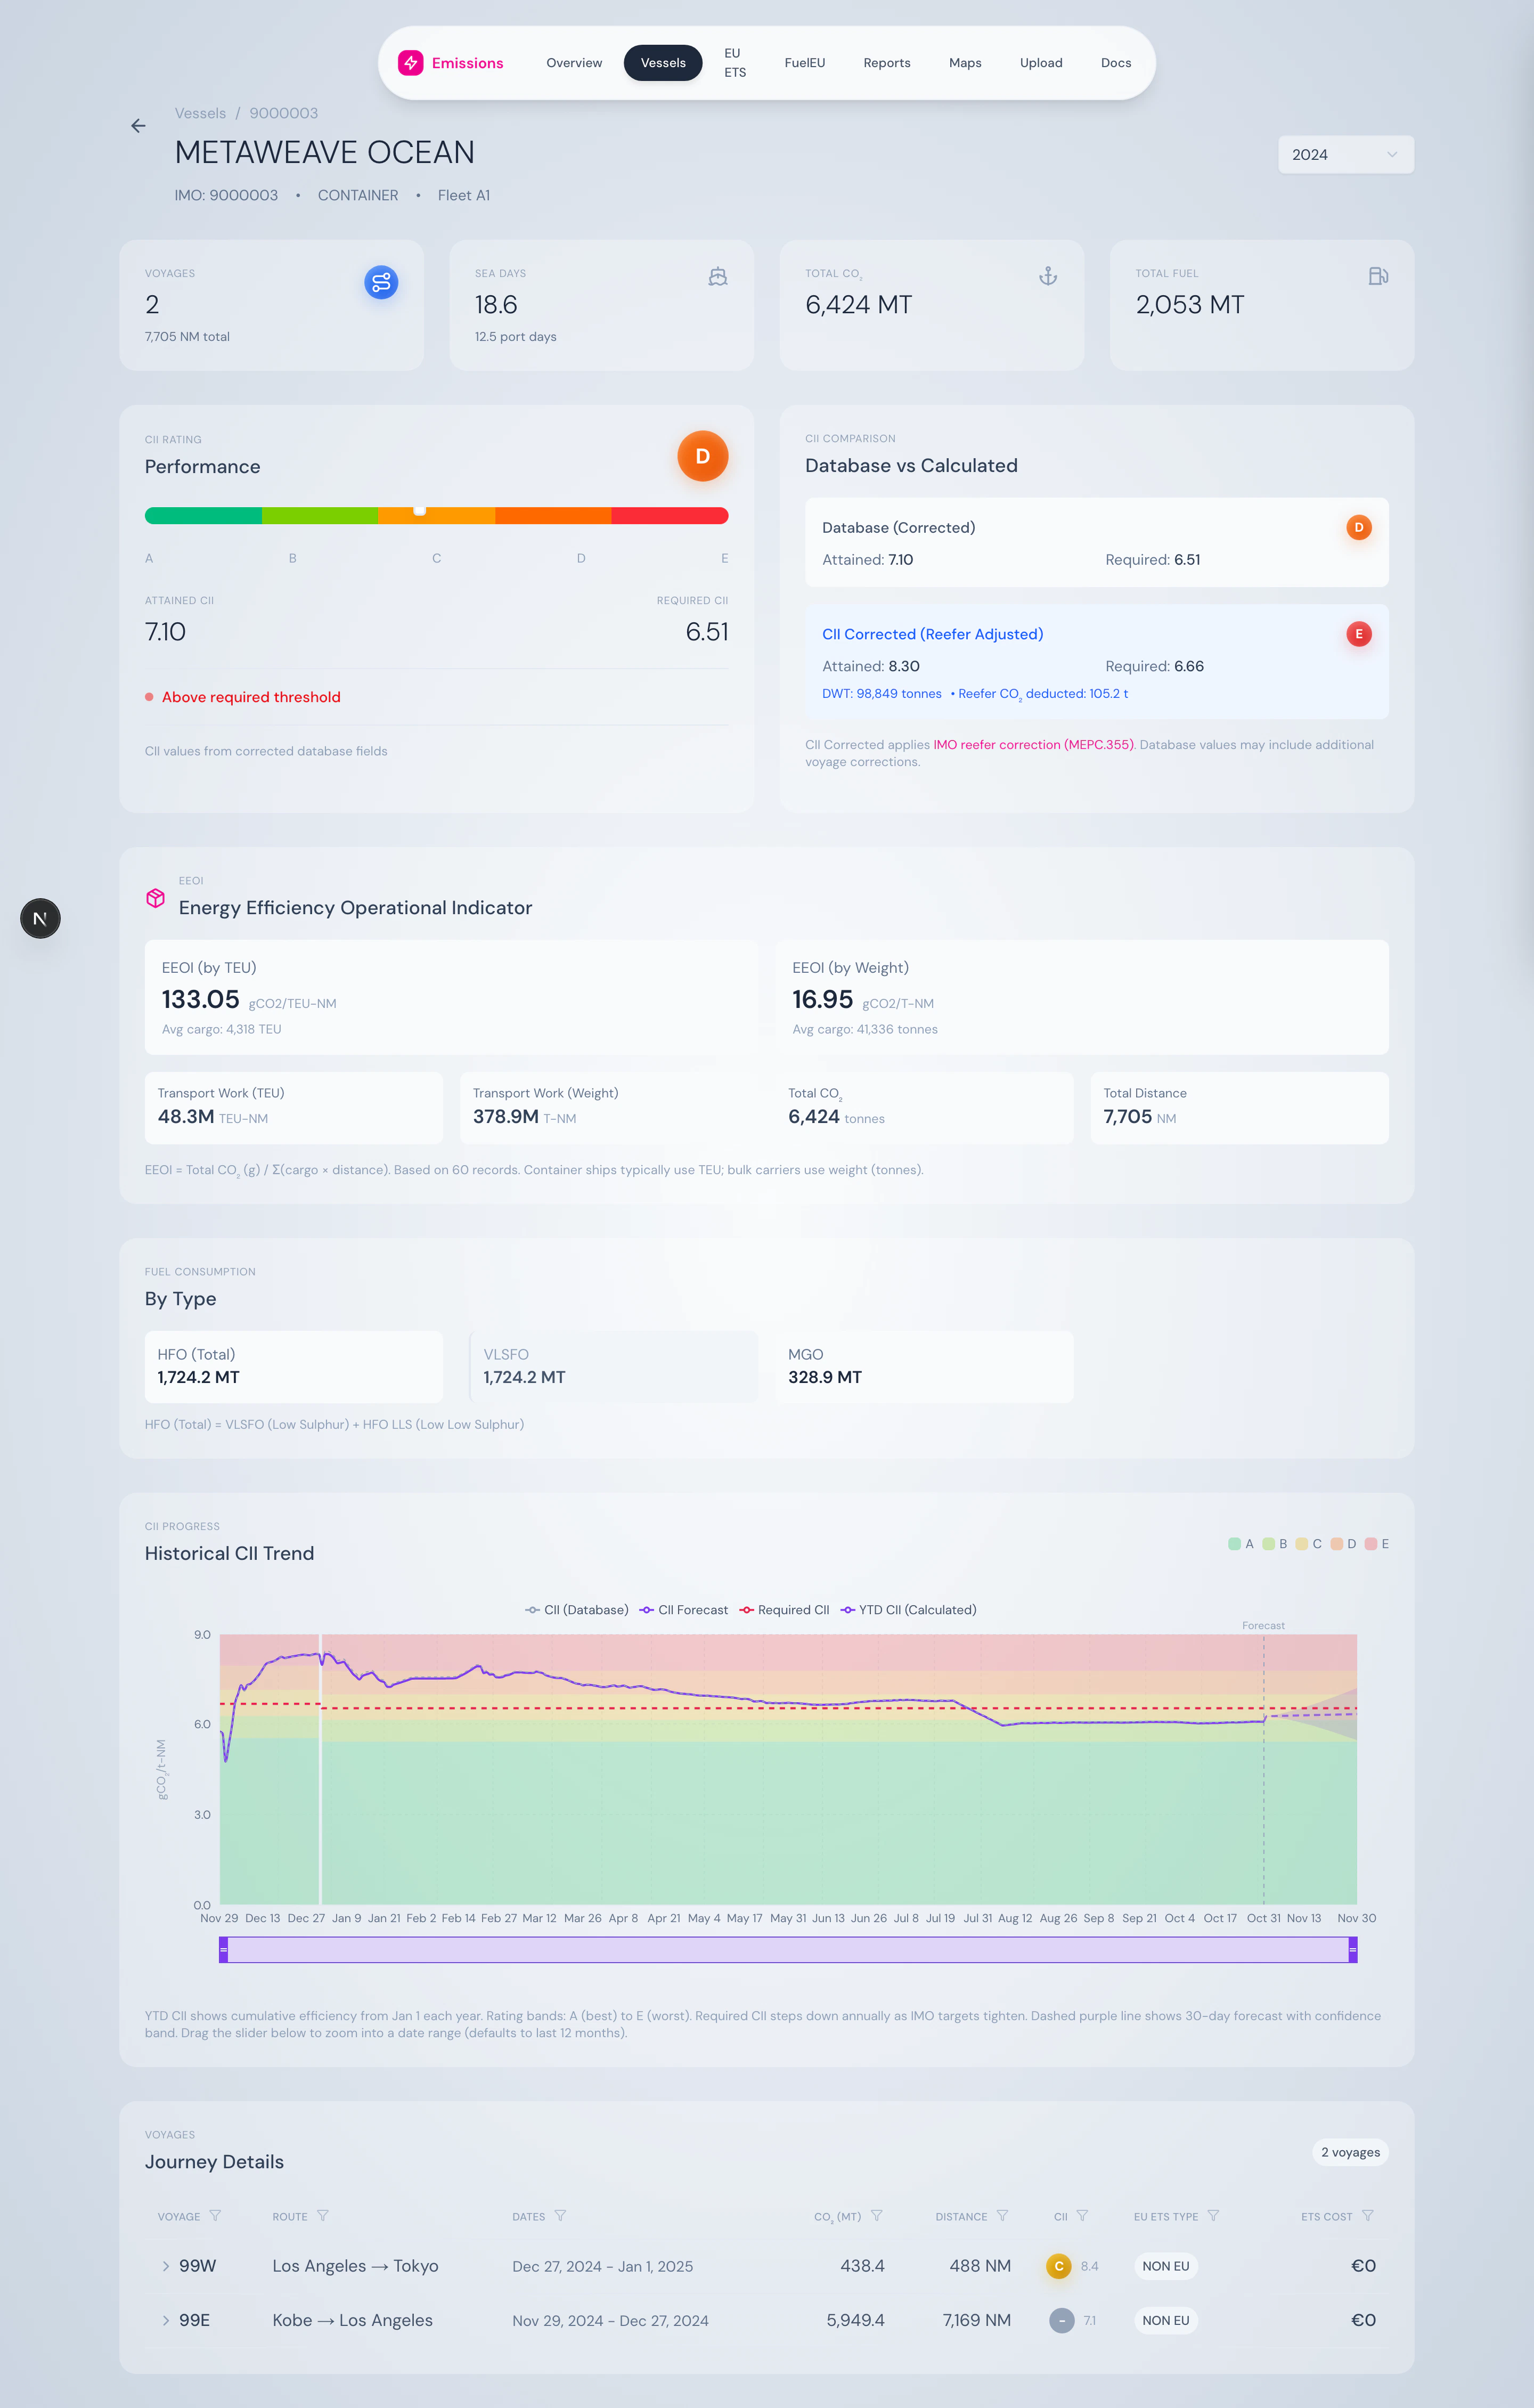
EEOI by TEU and by weight, with supporting transport-work metrics.
- EEOI by TEU — gCO₂ / TEU-NM (for container ships)
- EEOI by Weight — gCO₂ / tonne-NM (for bulkers and general cargo)
Fuel breakdown
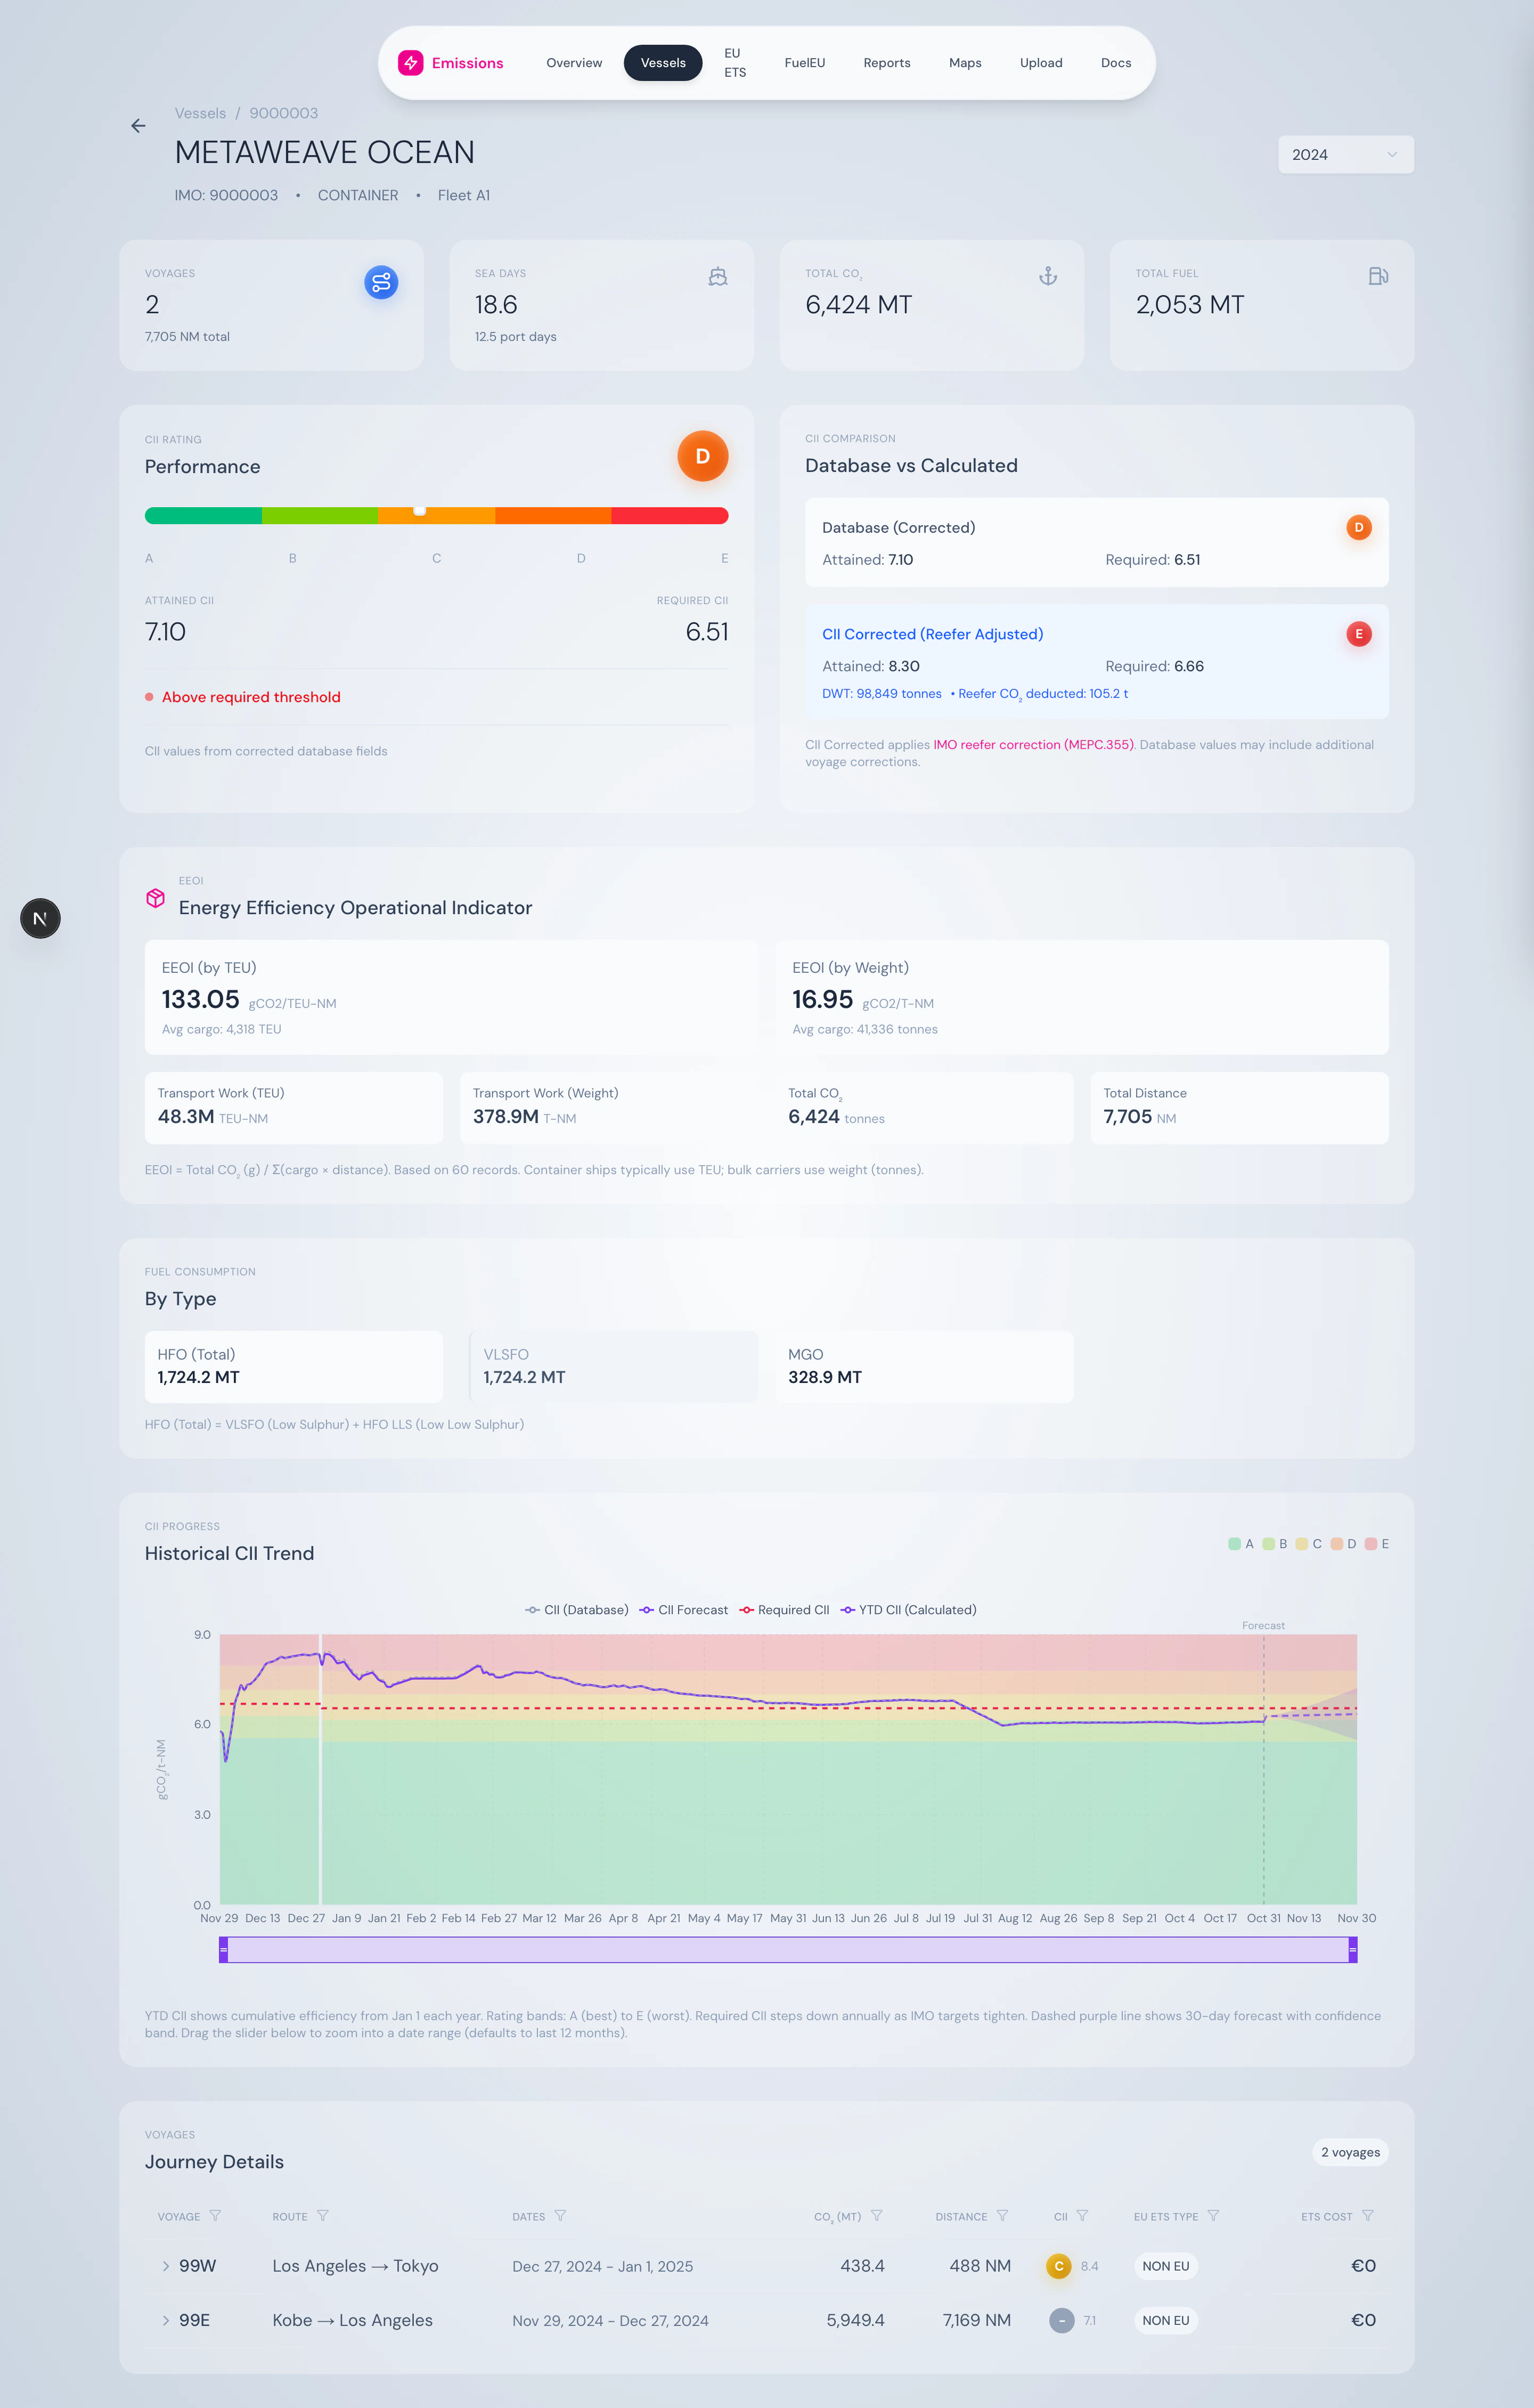
Fuel consumed in the year, hierarchical by fuel category.
- HFO (Total) = VLSFO + HFO LLS
- MDO / MGO
- LNG, Methanol, Biofuel blends, etc.
CII rolling chart
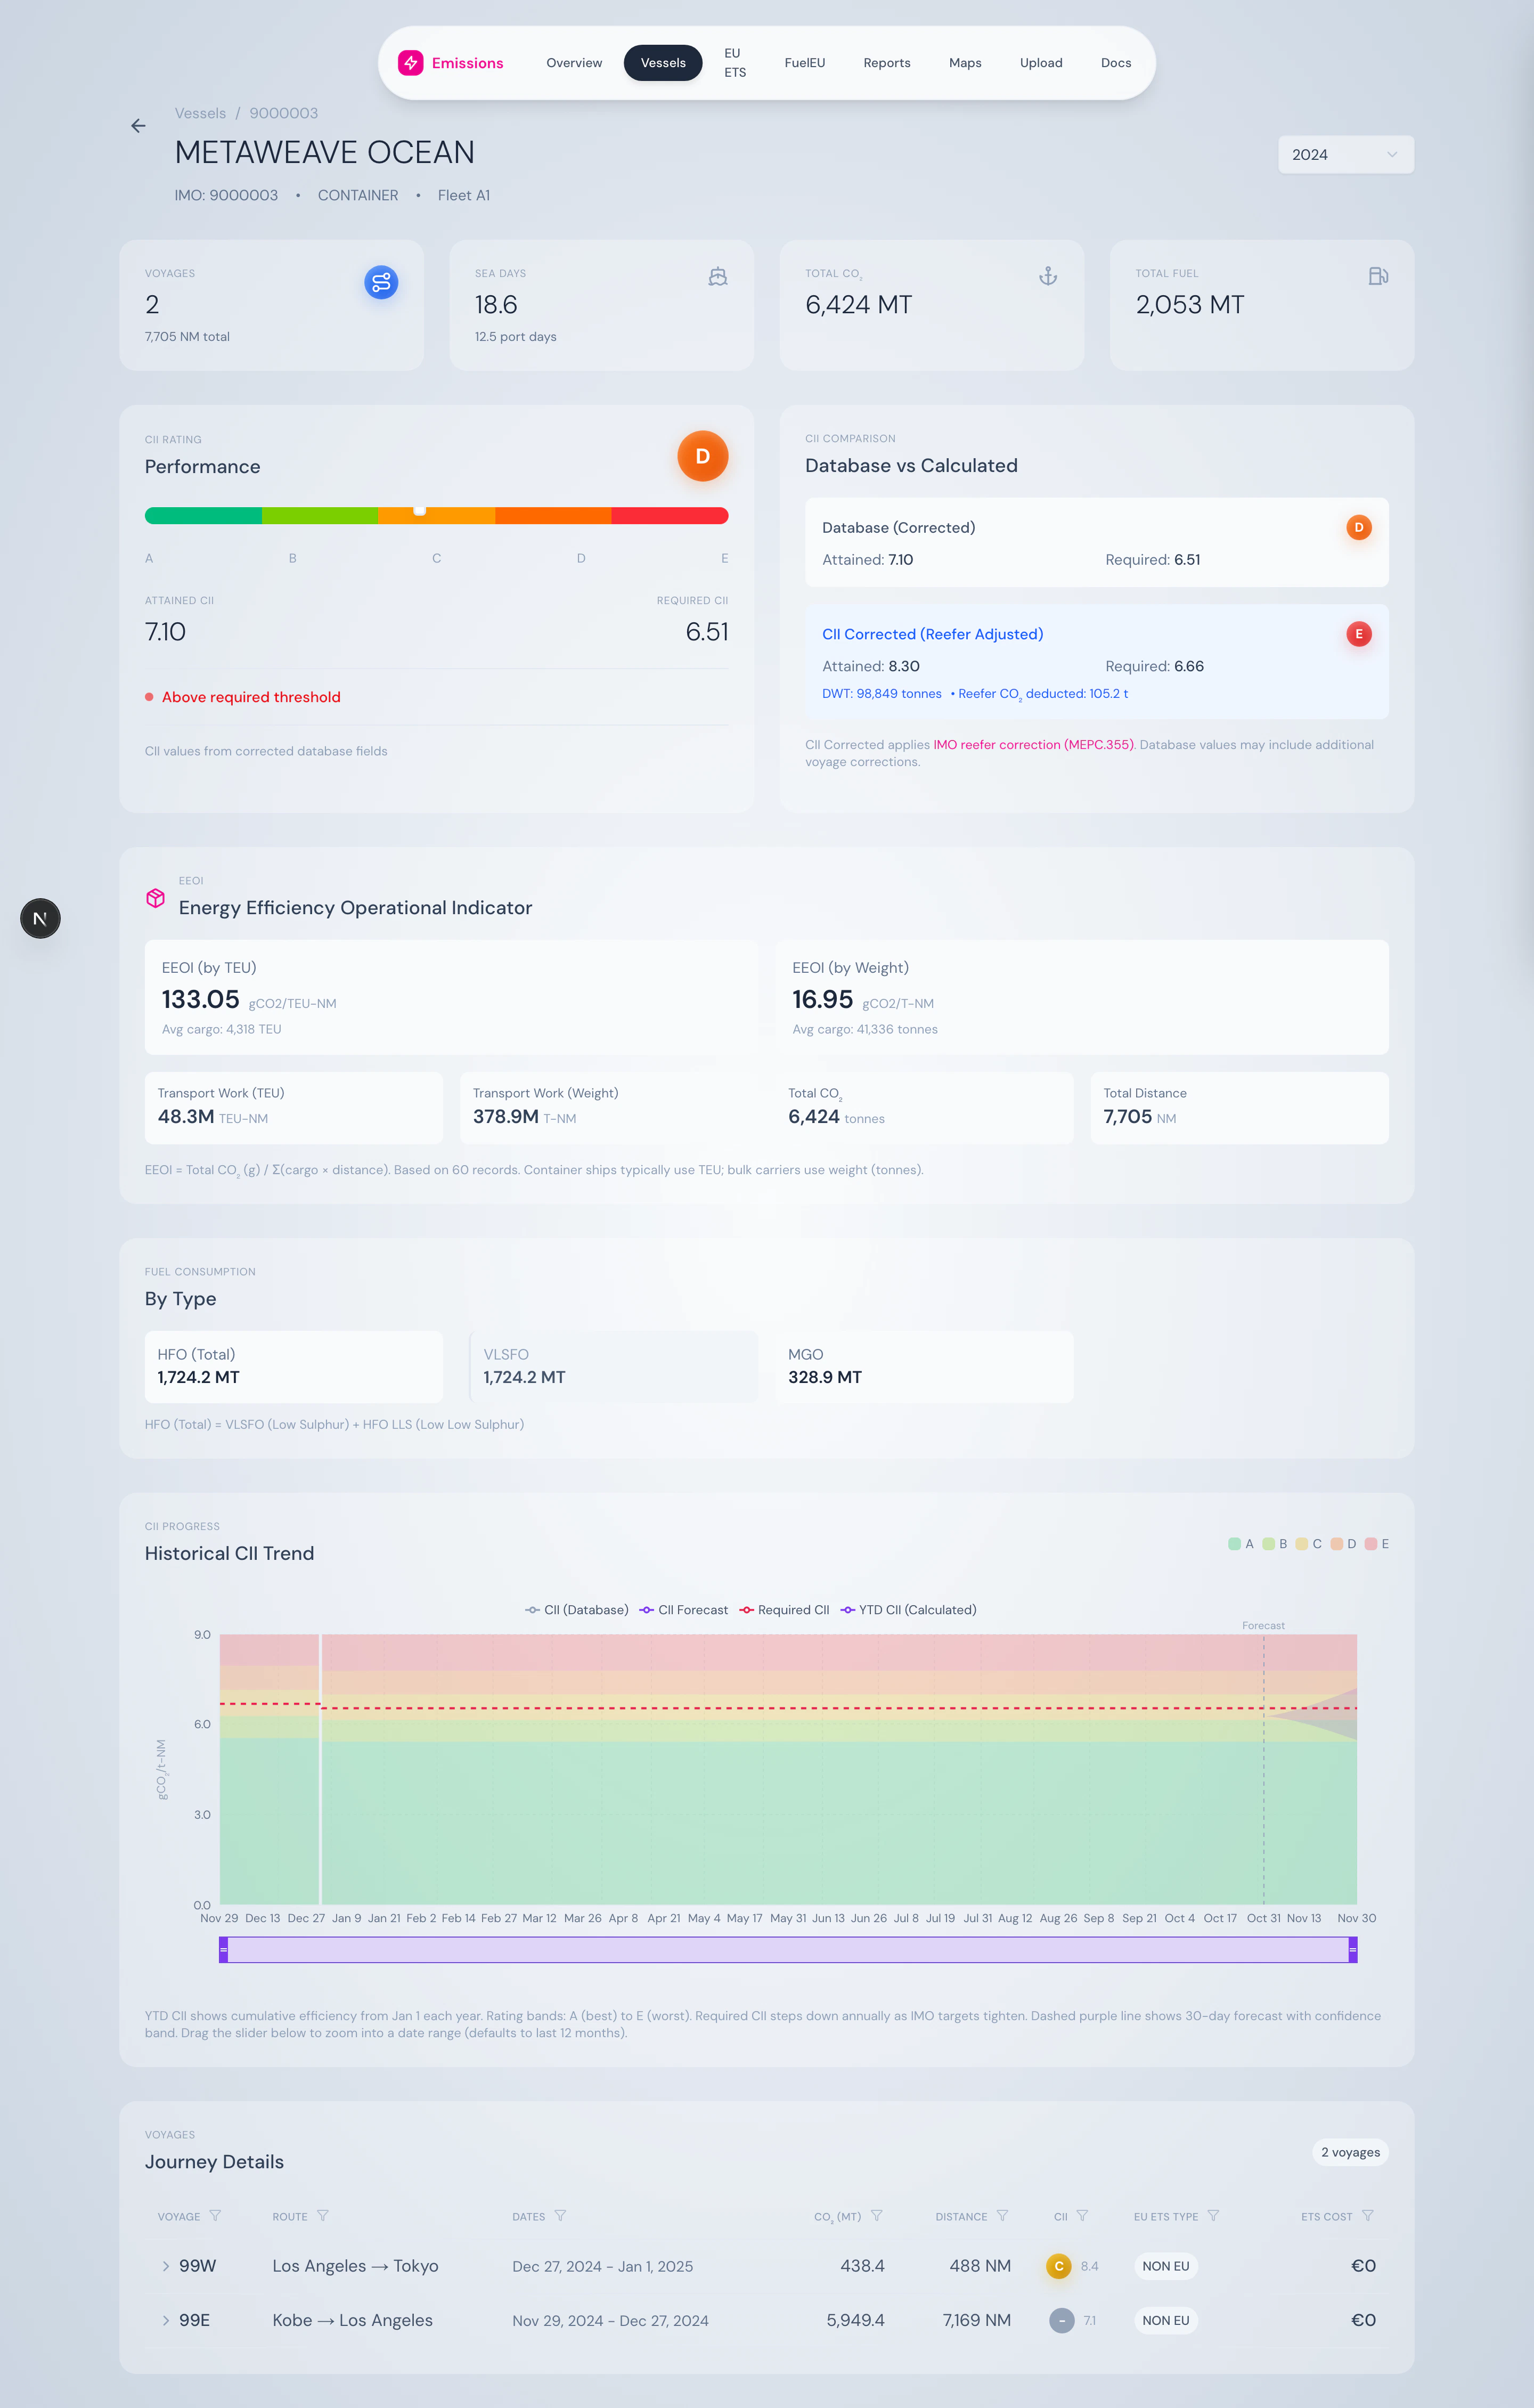
12-month rolling CII chart with required-CII step lines per year and brush-to-zoom.
Voyages table — expandable
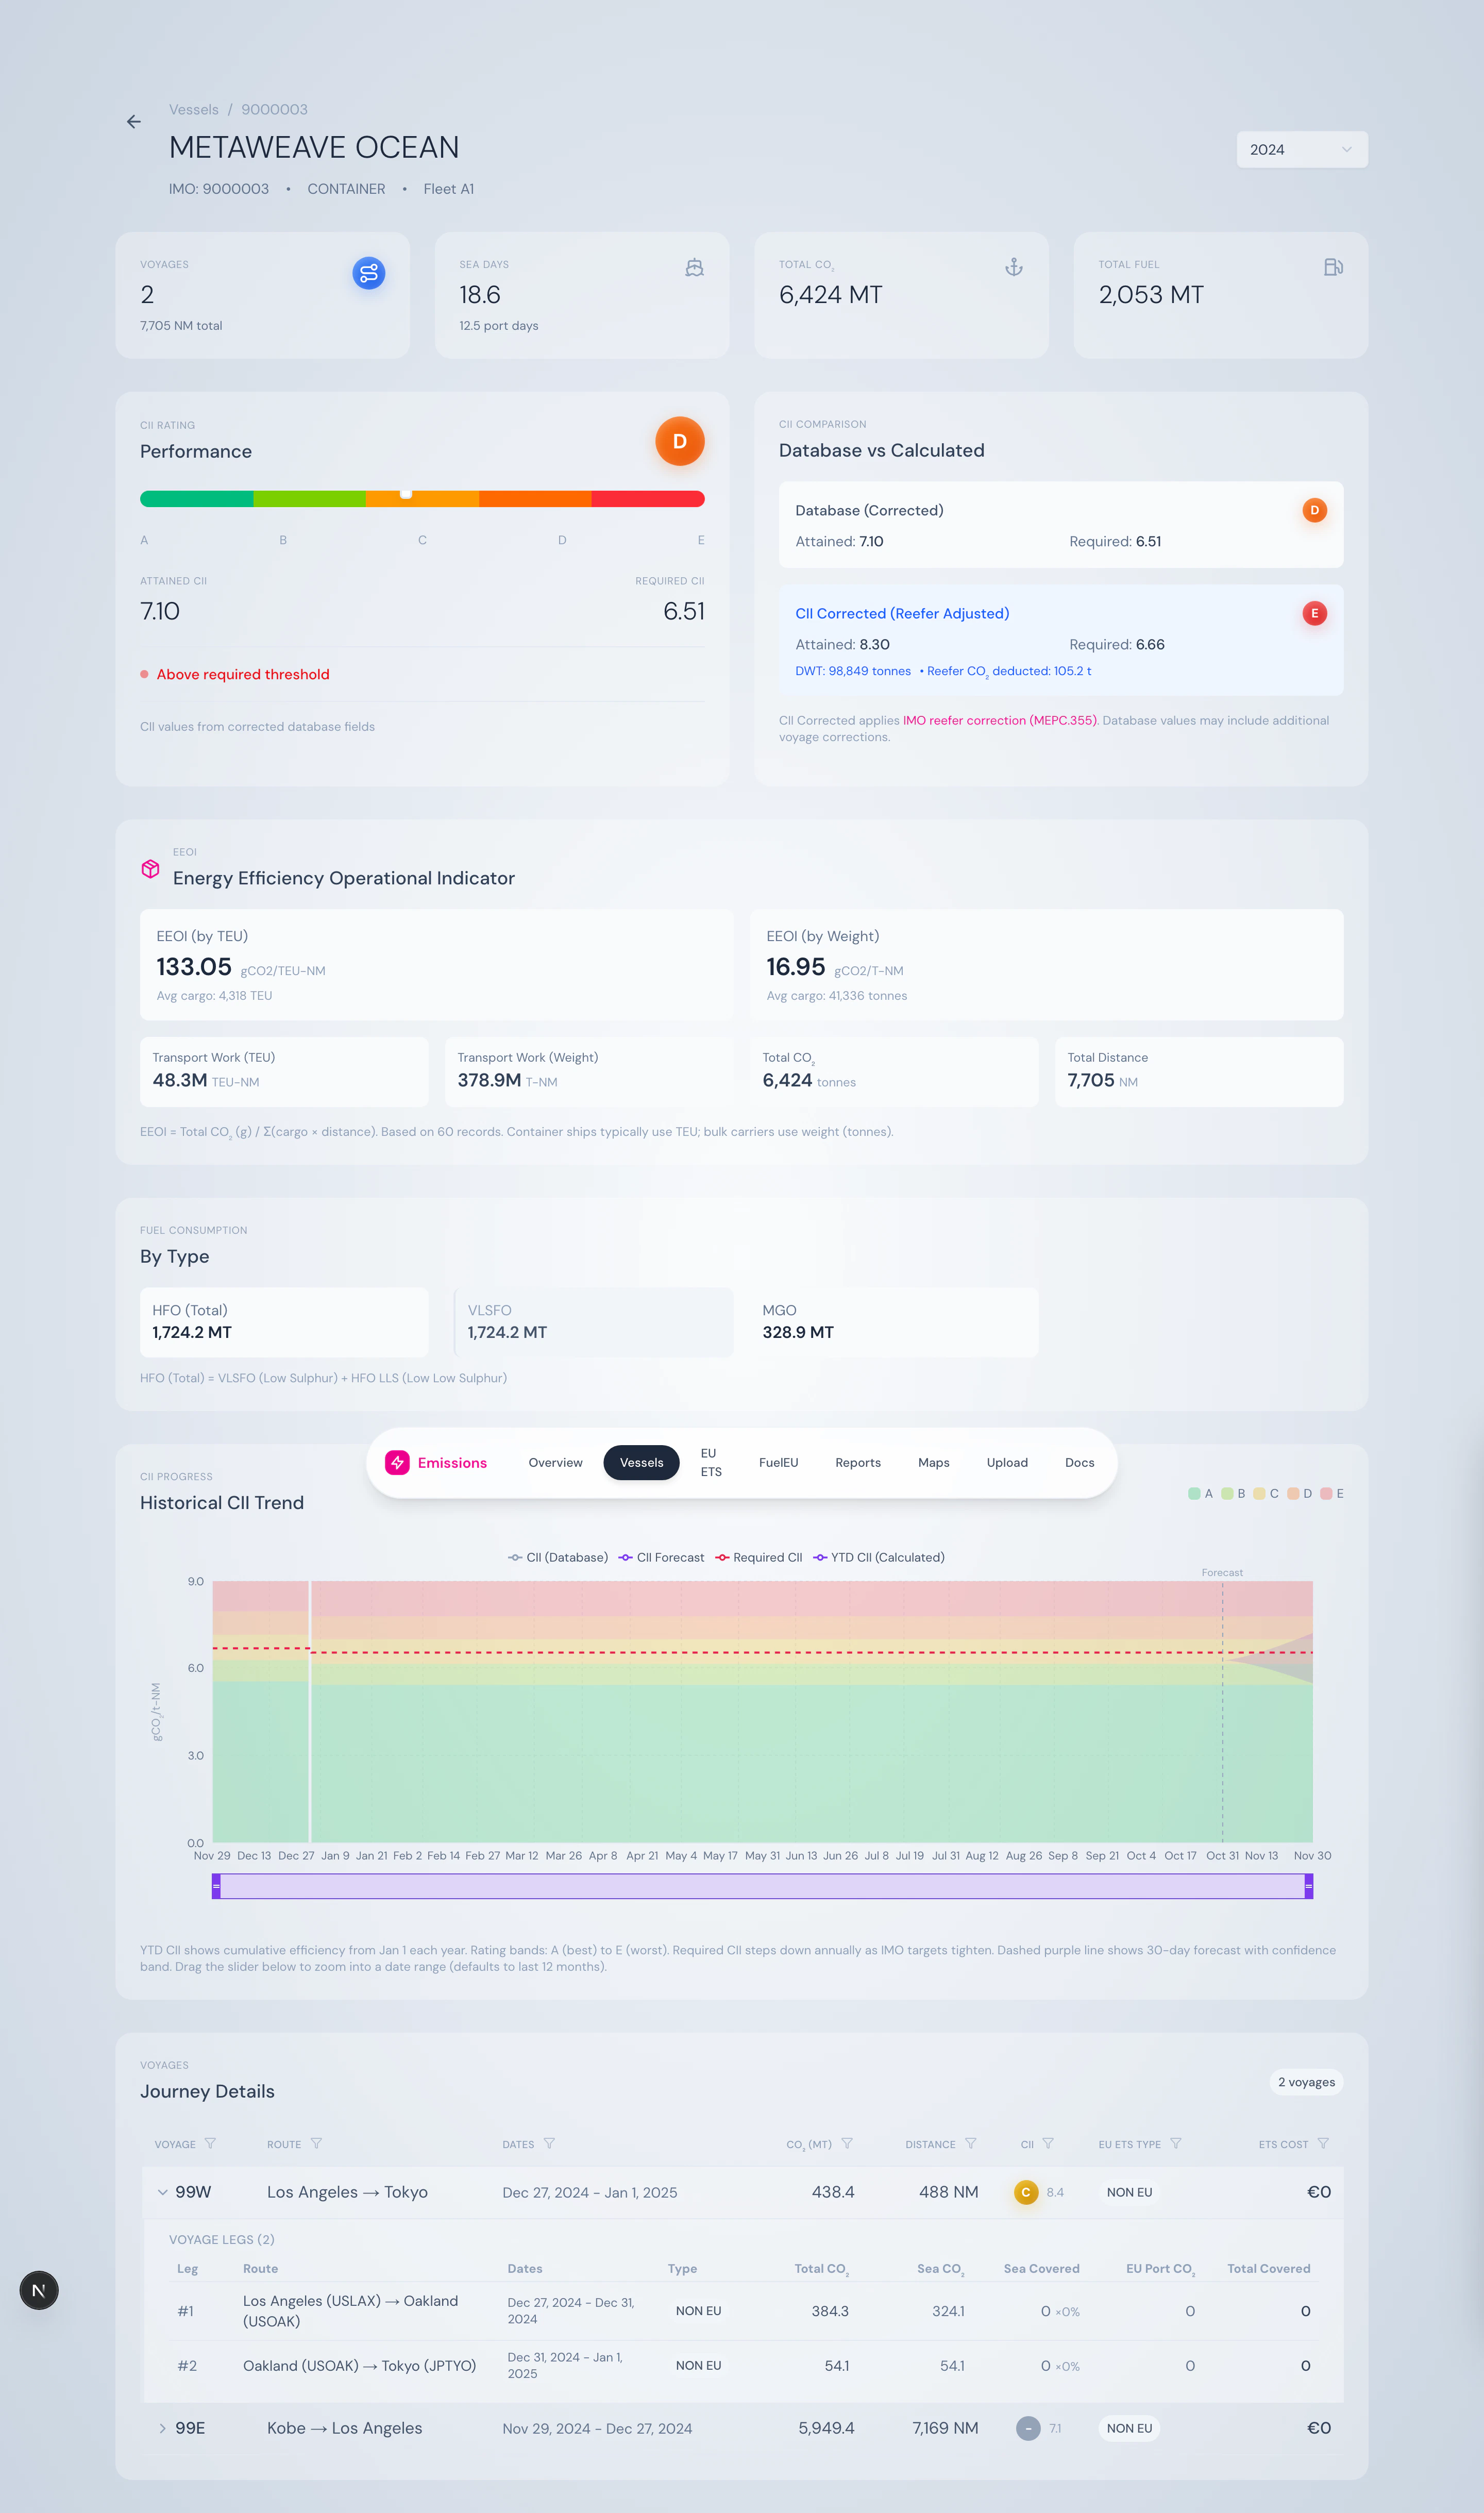
Voyages list, expandable row showing leg-by-leg ETS coverage.
- Leg # and route (port → port)
- Sea CO₂, sea-covered (with coverage %), EU port CO₂, total covered
- ETS coverage factor applied per leg
What you can do here
- See exactly which voyage and which leg generated each tonne of covered CO₂
- Compare attained CII trends against the required threshold over time
- Verify that reefer correction has been applied correctly
- Pick a year and see the year-end picture, or use YTD for live monitoring
- Use the breadcrumb to jump back to the fleet view
Source
Powered by/api/vessels/[imo], /api/vessels/[imo]/cii-daily, and /api/vessels/[imo]/voyages. Business logic in VoyageSegmentService and FleetService.